Get an Edge in Any Card Game


Is a shuffled deck of cards really randomly arranged?
This experiment could very likely surprise you, and there's a very good chance you've never seen this trick anywhere else. Keep reading, because this information can be very useful for any game based on playing cards as well as other number-based games like lotteries.
You'll need to pay attention to be sure you understand (apologies for the math and statistics!), but once you get this, you may be able to make some very effective predictions about the cards in your opponents hands!
Note that you do not have to perform this experiment yourself (unless you wish to.) We are showing this experiment to you so you will understand exactly why playing cards usually do not actually mix randomly.
The Setup
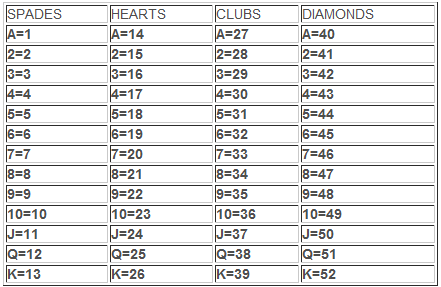
Let's start off with a normal brand new deck of 52 playing cards. We'll assign a number from 1 to 52 to each card, depending where it falls in the deck (see the number chart above.)
The key to what we're about to do I am calling a "delta analysis" ("delta" in statistics is the difference between two numbers.) As we draw cards, we will look at the differences between the numbers we assigned to each card. For example, if I draw a king, and then a queen of the same suit, I would record a delta number ONE. A king of clubs (number 39 on the above chart) and then a jack of clubs (number 37) is a delta TWO, because if I subtract 37 from 39, the result is 2.

Summary: For our experiment, we
1) Draw six cards at a time
2) Arrange the hand from lowest to highest numbers
3) Record the first 'delta' as the same number as the lowest numbered card (because there's no number preceding it)
4) Record the next five numbers as the differences between the card's number and the number assigned to the preceding card.
Example: If we were to choose any group of six consecutive cards from a brand-new unshuffled deck, the delta numbers between each of them would all be ONEs - precisely because all the assigned numbers are arranged right next to each other.
For the example analysis in the section below, I'm using a piece of software designed for lottery numbers, called 'Analysis Lotto', because this software is designed for studying delta numbers in lottery games. As you'll see, it can also be used for other types of statistical study.
Using this software is a useful shortcut, and enables me to make graphic charts that you can look at below. I'll also show how to do a computer-less version of this experiment with simple graph paper.
Doing the Experiment
So let's use the Analysis Lotto software to plot the delta numbers of several groups of six cards drawn from this deck. Here's what it looks like:
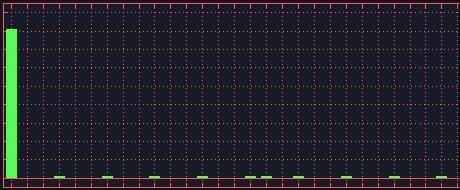
The ONE column (the first column) is very large, and the other columns are very small, since almost all the Delta numbers are ONE in an unmixed deck of cards. Contrast this to a delta chart of a thoroughly mixed deck:

In this randomized arrangement of cards, there is still an emphasis toward low deltas (highest bars on the left), but with a gradual slope downward toward fewer occurrances as the delta numbers get higher. This is what a normal distribution of random delta numbers looks like. (This shows that, even in a well randomized deck, finding cards close to each other is a more common scenario than finding widely separated cards.)

So lets shuffle our new deck of cards in the normal way, by splitting the deck in two parts and riffling the stacks together.
I'll bet you thought that this was a good way to randomly mix cards, didn't you?
However, the computer shows us that this deck is clearly not random after a shuffle:

You can see this chart does not match the chart of random cards we showed you earlier - not even close. I guess we need to mix the deck more thoroughly.
Here's the deck after two shuffles:

And after three shuffles:

Frustrating, isn't it?
So let's shuffle the deck TEN TIMES. Surely it will look random now?
Let's see. Here's what the delta chart looks like:

If you were to look through the cards, the deck would certainly SEEM to be randomly arranged after ten shuffles. At this point, it is only by using the computer to chart the proportions of the various delta numbers that we can uncover this non-randomness. That we are able to discover mixing errors like this illustrates how delta number analysis works, and how powerful it is for analyzing randomness. (The author of this software applies the same kind of analysis to lottery number ball mixing.)
Math experts will very likely tell you that a deck of cards is completely mixed after seven shuffles. But - doing this experiment, and looking at the resulting delta charts, it actually took me better than FIFTEEN shuffles before the deck was clearly randomized - that's twice as many shuffles as our math experts think it takes!
NOTE: I am shuffling in a very typical way. It is certainly possible that I am woefully untalented at shuffling cards (however no worse than an average person.) In any event, you can clearly see that delta number analysis is particularly sensitive for spotting non-random mixing.
Doing the Experiment Yourself
Here's how to do the experiment yourself - I'll show you how to do it using either the Analysis Lotto software we mentioned above, or graph paper and pencil. The software is available as a free trial, and will work fine for this experiment without purchasing it.
First, arrange the cards in the numerical order listed in the chart at the top of this article - and keep the list handy, as it shows which number is assigned to each card.
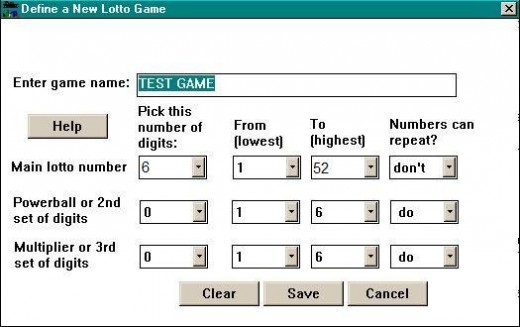
Software method: Choose DEFINE NEW GAME from Analysis Lotto's File menu (example above), and name the game TEST GAME. Set the game up as 6 numbers from 1 to 52, no repeats, and make all the other numbers zero. Back at the main screen, set "Picks Generated From" to RANDOM NUMBER PATTERNS.
Arrange the cards in the order shown above, then shuffle the deck three to five times.
Click on ADD LATEST NUMBER. Take the first six cards off the top of the deck, and using only the numbers we have assigned to each card in the chart at the top of this page, enter those six numbers into the box, and hit GO. Then take the next six, enter them, and hit GO again. Go through the whole deck like this (you'll get about 8 combinations.) When finished, hit ADD to build the database.
Now, from the Chart menu, choose the DELTA DISTRIBUTION chart. You should see an exaggerated emphasis on delta ONEs, like in our example chart earlier on the page. Compare this to what random should look like by pushing the NEXT button in the lower right corner of the chart (you will then see a chart of picks generated from random numbers.)
Doing the Experiment on Graph Paper
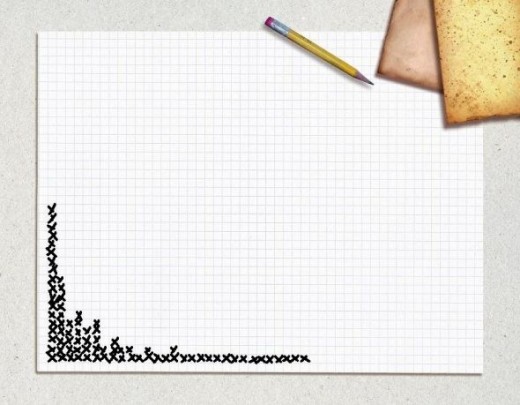
We don't have to use lotto software to do this, it's just a little bit more effort. To do the above experiment on graph paper, Number the squares across the bottom of the paper from 1 - 50. Number squares going up the side from 1 - 10.
Arrange the cards in the order shown above, then shuffle the deck three to five times.
Take each set of six cards from the top of the deck and arrange them in numerical order (using numbers from the list above.) The first delta number is the lowest number picked. Calculate the following deltas by subtracting each number from the one before it. Darken a square of your graph paper according above the delta number you get. You should wind up with something that looks like one of our lotto software charts.
How to Use Your New Knowledge
This insight is going to be most useful in a game when starting with a new, unmixed deck of cards, or a deck that has been arranged back into new card order. Observe how many shuffles the dealer does. Assuming a normal deal, where the cards come off the top of the deck and go around to each player one card at a time, you can assume that there is a high likelihood that other players have cards separated in value from yours by small increments. Calculate the deltas between the cards in your hand - are many of them roughly equal to the number of players plus one? The closer this calculation is to this number, the more unmixed the deck is, and the easier it will be to predict other players hands.
Of course, since the deck has been mixed - however imperfectly - there is no way to know exactly what hands the other players have. However, you may still be able to make some amazing educated guesses about your opponents cards!
Here's the software we used for our card experiment
- Analysis Lotto software
Lottery software that can also be used for delta number analysis of cards, and other statistical tasks involving the study of number shuffling or mixing. Click the link above.


")


